
August 31, 2026
Size Staff and Shelving: Package Volume Forecasting for Apartments
Build a practitioner-ready package volume forecast for apartment communities. Use the 1.5 packages/unit baseline, staff-hour math, shelving needs, and...
Start with 1.5 packages per unit per week, or roughly 0.5 per resident per week, as your baseline if you have no historical data. That single number lets you rough out staffing hours, shelving needs, and a surge buffer before you’ve logged a single box. Pull your last 30 days of intake records this week and use them to replace the guess with a real number specific to your property.
TL;DR:
- Property managers should use 1.5 packages per unit per week as a minimum baseline, adjusting upward for properties exceeding national averages.
- Package volume peaks significantly during the holiday season and move-in weeks, requiring staffing models that account for 2 to 4 times the normal volume.
- Weekly audits and consistent carrier onboarding are essential to maintain forecast accuracy and avoid resident disputes over missing packages.
- Open shelving combined with lockers is recommended for higher-volume properties to better handle oversized, refrigerated, or surge-delivered items.
- Using dedicated on-site package management services ensures operational discipline, accurate data collection, and effective handling during peak periods.
Table of Contents
- What Is Package Volume Forecasting for Apartment Communities?
- How Do You Build a Package Volume Forecast in a Spreadsheet?
- How Do You Size Shelving, Lockers, and Staff From a Forecast?
- How Much Do Package Volumes Spike During Holidays and Move-Ins?
- Which KPIs Tell You When to Adjust Staffing or Open Overflow?
- What’s the Minimum Dataset You Need to Keep a Forecast Current?
- How Postal Solutions Applies Forecasting in Real Package Rooms
- How Should You Handle Unexpected Disruptions to Your Forecast?
- How Do External Factors Like Promotions and Market Trends Affect Package Volume?
- Do You Need Machine Learning to Forecast Package Volume?
- What Software Actually Helps With Package Volume Forecasting?
- Where Does Your Package Volume Data Actually Come From?
- Why Do Carrier Intake and Chain-of-Custody Controls Matter So Much?
- The Real Gap in Most Forecasting Advice
- Let Postal Solutions Run the Forecast and the Package Room
- Sources
- FAQ
What Is Package Volume Forecasting for Apartment Communities?
Package volume forecasting means predicting how many parcels will arrive at your property, and when, so you can staff and equip your package room before the boxes show up instead of after. It’s the multifamily equivalent of a restaurant predicting Friday dinner rush: get it wrong and you either overpay for idle labor or watch packages pile up in a hallway.
The starting benchmark comes from a Metrans study of a 300-unit building that logged 23,613 parcels in a single year, working out to about 1.53 deliveries per unit per week. That’s close enough to the 1.5-per-unit rule to use as a universal starting point across most conventional multifamily properties. Industry data from NAAHQ puts the average community at nearly 150 packages per week total, which lines up with the per-unit figure once you factor in typical occupancy.
Two patterns matter more than the raw average:
- Weekday skew. Wednesday is consistently the peak intake day, accounting for about 19% of weekly volume in the Metrans sample, while weekends drop off sharply since most carriers scale back Saturday and Sunday routes.
- Holiday concentration. November and December together account for roughly 20.9% of annual deliveries, meaning your fourth quarter needs a materially different staffing model than your spring numbers.
- Carrier mix shifts arrival timing. USPS tends to run steady midday drops, UPS and FedEx cluster in afternoon windows, and Amazon’s own delivery network often adds evening surges, particularly on properties near urban distribution hubs.
Quick stat: A third of on-site teams report spending more than four hours a week just handling packages, before any holiday surge is factored in.
If your property runs above the national averages, don’t assume something’s wrong. Use the 1.5-per-unit figure as your floor, not your ceiling.
How Do You Build a Package Volume Forecast in a Spreadsheet?
You don’t need forecasting software to get a workable number.
Step 1: Collect clean intake data. Every logged parcel needs four fields at minimum: date, carrier, unit number, and an oversize/refrigerated flag. Skip the unit field and you can’t segment demand by building or floor; skip the oversize flag and your shelving math will be wrong later.
Step 2: Calculate your baseline. Average total parcels per week over your logging period, then divide by total units. If you’ve only got two or three weeks of data, use a 7-day rolling average rather than a single week’s snapshot, since one heavy Amazon Prime Day or a slow rain week will otherwise skew your baseline.
Step 3: Apply seasonality multipliers. Layer weekday and monthly factors on top of the baseline.
Step 4: Add a surge buffer. Move-ins, lease-turn weeks, and known promotional events (a resident-wide Amazon Prime Day, for instance) deserve their own multiplier on top of seasonality. A conservative planning buffer of 15% to 25% above your seasonally-adjusted forecast keeps you from getting caught flat.
Step 5: Convert to parcel-days and staff-hours. Multiply forecasted daily arrivals by average pickup hold time in days to get parcel-days of shelving demand, then multiply arrivals by your intake-and-sort time per parcel (typically 90 to 120 seconds in a non-automated workflow) to get daily staff-hours. This is where a static spreadsheet becomes a real operating plan, tying directly into how packages get delivered to apartments on your carrier’s actual schedule.
How Do You Size Shelving, Lockers, and Staff From a Forecast?
Once you have a daily arrival number, capacity planning is arithmetic, not guesswork. The two variables that matter most are hold time (how many days packages sit before pickup) and parcels-per-shelf-foot for your specific shelving unit.
Convert forecasted arrivals into parcel-days: multiply daily arrivals by average hold time. A property forecasting 60 parcels a day with a 2-day average hold needs shelving capacity for around 120 parcel-days at any given moment, not 60. Divide that by your shelf’s parcels-per-linear-foot to get required shelf footage.
Locker banks work well for standard-size, single-resident deliveries but struggle with oversized and temperature-sensitive items, which is why most high-volume properties pair lockers with open shelving for overflow rather than relying on lockers alone. Open shelving also scales more gracefully during a holiday spike, since you’re adding shelf rows instead of running out of fixed compartments.
Here’s how the math plays out across three property sizes:
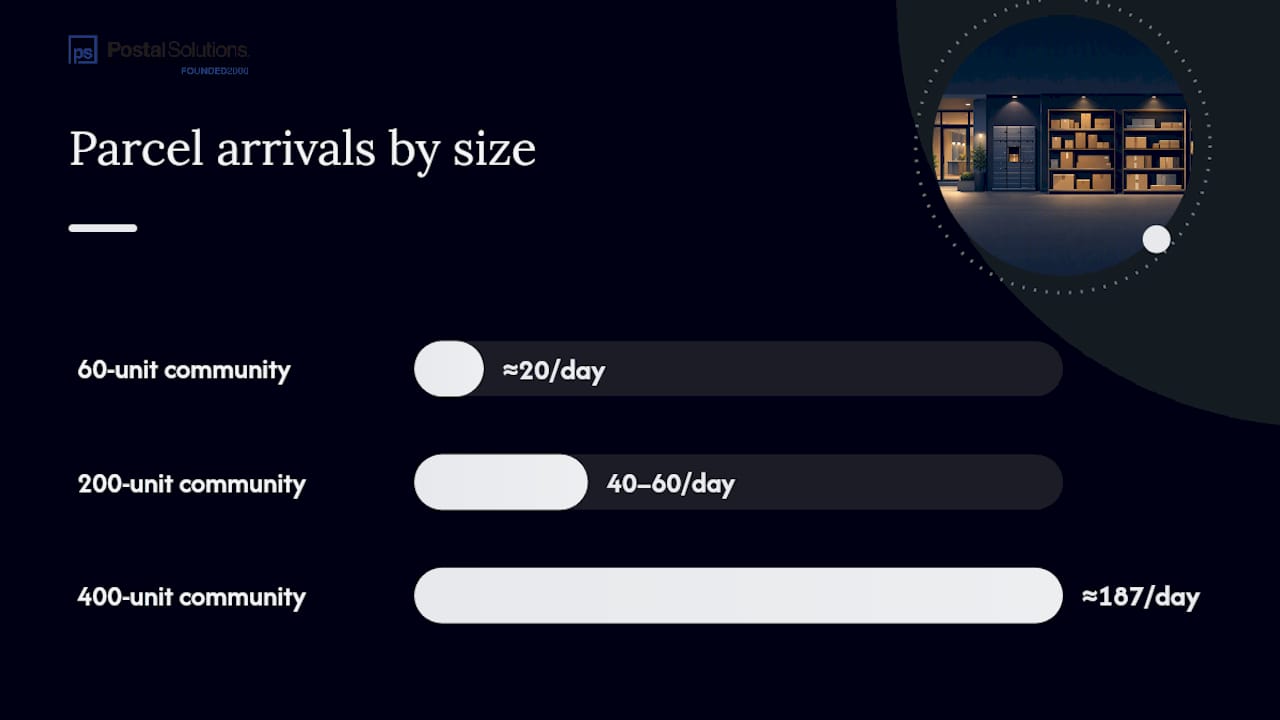
- 60-unit community: roughly 90 packages/week baseline, under 20 parcels/day. A single locker bank or small shelving unit typically covers it, with a part-time on-site presence a few days a week.
- 200-unit community: roughly 300 packages/week baseline, 40 to 60 parcels/day, climbing toward 80 during holidays. This tier usually needs daily intake coverage and a dedicated shelving room.
- 400-unit community: some operator case studies show properties this size receiving around 187 packages a day even outside holidays, which demands near-full-time staffing and a combined locker-plus-shelving setup.
Pro Tip: Segment your portfolio by daily volume, low under 20, medium 20 to 60, high above 60, before you decide between lockers, a managed room, or an offsite solution. Matching the model to the tier saves you from over-building at a 60-unit site or under-building at a 400-unit one.
Staffing time isn’t just intake. Budget separately for sorting and shelf organization, resident pickup assistance, and a recurring weekly audit block, since skipping the audit is how misplaced packages turn into resident complaints weeks later.
How Much Do Package Volumes Spike During Holidays and Move-Ins?
Plan for a 2x to 4x multiplier over your baseline during peak windows, not a modest bump. NAAHQ data shows average weekly volume jumping from about 150 packages to roughly 270 during the holiday season, an 80% increase, and locker-specific deliveries can climb even faster, with some properties seeing 75% more locker deliveries in the week following Black Friday alone.
The calendar windows to pre-plan around are predictable every year:
- Late November through December 25: the single largest sustained surge, driven by holiday shopping and gift shipping.
- Move-in weeks (typically August and January for many markets): new residents ordering furniture, electronics, and household goods all at once.
- Amazon Prime Day and major sales events: shorter, sharper spikes that can hit locker capacity within 48 hours.
Operational responses need to be planned before the surge, not during it. Set up a designated overflow room or temporary shelving ahead of the November crunch. Schedule extra shifts for the two weeks flanking Christmas. Coordinate directly with carriers so drivers know where overflow goes when the primary room fills, since an uncoordinated carrier will simply leave packages wherever is convenient.
Communication matters as much as physical space. Send residents advance notice of pickup deadlines during high-volume weeks, and make sure any new locker or room-access hardware is part of formal carrier onboarding so drivers aren’t guessing at your intake workflow during your busiest days of the year.
Which KPIs Tell You When to Adjust Staffing or Open Overflow?
A forecast is only useful if you’re checking it against reality. Five numbers deserve a spot on your weekly dashboard: daily arrivals, average dwell time before pickup, percentage of packages picked up within three days, overflow incidents per week, and delivery failure or misdelivery rate.
- Daily arrivals exceed forecast by 20% or more for three consecutive days. Trigger: call in extra staff hours or shift a team member from leasing support temporarily.
- Average dwell time climbs past 4 to 5 days. Trigger: push a resident notification reminder and check whether locker capacity is actually full.
- Overflow incidents (packages stored outside the designated room or locker) happen more than once a week. Trigger: open a temporary overflow space and reassess shelving capacity for the season.
- Delivery failure rate rises, meaning carriers can’t complete drop-off because of access or space issues. Trigger: review carrier onboarding and intake protocols immediately.
Quick stat: Roughly a third of property teams already spend more than four hours weekly on package handling under normal conditions, so a KPI breach during peak season compounds fast if it isn’t caught early.
Weekly audits and chain-of-custody logging aren’t just compliance boxes to check. They’re the fastest way to catch a forecast that’s drifted from reality before residents start noticing missing packages.
What’s the Minimum Dataset You Need to Keep a Forecast Current?
You need less than you think. A single spreadsheet tab with columns for date, carrier, unit, parcel count, and an oversize flag covers the intake side. Add a weekly summary tab that auto-calculates your rolling 7-day average, applies your seasonality multiplier, and layers on a surge buffer percentage.
- Checklist: log every intake same-day, review weekly totals every Monday, assign one owner for data entry, and run a physical audit against the log monthly at minimum.
- Formula guidance: baseline = 7-day rolling average of parcels per unit; seasonal forecast = baseline × monthly multiplier; surge-adjusted forecast = seasonal forecast × 1.15 to 1.25.
| Column | Purpose |
|---|---|
| Date | Tracks day-of-week and monthly trends |
| Carrier | Flags onboarding gaps by delivery service |
| Unit | Enables per-building or per-floor segmentation |
| Parcel count | Feeds baseline and seasonality math |
| Oversize/refrigerated flag | Drives shelving and special-handling capacity |
A worked example: at 0.5 packages per resident per week in a 200-resident building, that’s 100 packages weekly, roughly 14 to 15 a day. At 100 seconds of intake-and-sort time per parcel, that’s about 25 minutes of pure handling time daily, before pickup assistance or the weekly audit block.
How Postal Solutions Applies Forecasting in Real Package Rooms
Postal Solutions builds forecasting into the job itself rather than treating it as a separate planning exercise. A dedicated on-site Package Manager works your community up to six days a week, which means the weekly audit and chain-of-custody logging that catch a drifting forecast happen as a matter of routine, not as an afterthought squeezed into a leasing agent’s schedule.
That operational rhythm, carrier onboarding, staged shelving for surge weeks, documented intake, is what turns a spreadsheet forecast into a package room that actually holds up during a November spike. It also frees your leasing team from sorting boxes entirely, redirecting that time toward renewals and tours. Many communities structure the service as a paid resident amenity, turning what used to be a budget drain into a line that can help cover its own cost.
How Should You Handle Unexpected Disruptions to Your Forecast?
Every forecasting model built on historical averages breaks when something genuinely unprecedented happens. A regional carrier outage, a citywide event driving a temporary population surge, or a disruption on the scale of the early pandemic lockdowns can push volume 3x or more above any seasonal multiplier you’ve built.
The fix isn’t a more sophisticated model. It’s a documented fallback plan that doesn’t depend on forecasting accuracy at all. Keep a designated overflow space that can be activated within a day, not a week. Pre-negotiate flexible labor coverage, whether that’s a staffing partner, cross-trained leasing staff, or a managed service that can scale hours on short notice, so a spike doesn’t require a hiring process mid-crisis.
Treat any anomaly as a signal to separate the disruption from your baseline data rather than let it corrupt your rolling average. Log the anomaly separately with a note on the cause, since that record becomes useful the next time something similar happens, whether it’s a weather event, a nearby carrier facility closure, or a local surge in online ordering.
The properties that weather disruptions best are the ones that already have overflow space and flexible labor built into their normal operating model, not the ones scrambling to invent a response after volume has already tripled.
How Do External Factors Like Promotions and Market Trends Affect Package Volume?
Your forecast lives inside a bigger retail calendar, and ignoring it is one of the most common forecasting mistakes. National promotional events, Amazon Prime Day, Black Friday, Cyber Monday, and major retailer sales all drive predictable, dated spikes that have nothing to do with your property’s normal seasonality curve.
Layer these into your calendar the same way you’d layer in the November-December holiday multiplier. Prime Day alone has been tied to locker delivery increases of up to 75% in the following week at some properties, a spike that a simple monthly average would completely miss since it doesn’t respect calendar-month boundaries.
Local market trends matter too, even if they’re harder to quantify precisely. A new e-commerce fulfillment center opening near your property can shift carrier routing and delivery frequency. A shift in your resident demographic, more remote workers, more students, more young professionals, tends to push package volume up regardless of broader retail trends, since these groups order online more frequently on average. Rising local rent and slower move-out cycles also mean occupancy stability, which keeps your baseline steadier year over year rather than requiring a fresh recalculation every time turnover happens.
The practical move is a shared calendar, not a complex model: mark every known national promotional date at the start of each quarter, apply a temporary multiplier for that week alone, and reset to your normal seasonal forecast the week after. This catches most of what actually disrupts your numbers without requiring predictive software.
Do You Need Machine Learning to Forecast Package Volume?
Not at the property level, and probably not at the portfolio level either unless you’re managing dozens of buildings with meaningfully different resident profiles. The spreadsheet method covered earlier, baseline plus seasonality plus surge buffer, gets most communities within a workable margin of actual volume, and the effort required to build and maintain a machine learning model rarely pays off at single-property scale.
Where more advanced techniques earn their keep is time series analysis across a larger portfolio. If you’re managing 15 or 20 properties, a model that accounts for trend, seasonality, and residual noise separately (the classic decomposition approach behind tools like ARIMA or Facebook’s Prophet) can flag which properties are drifting from their expected pattern faster than a human reviewing spreadsheets one at a time. That’s a portfolio-management use case, though, not something a single 200-unit community needs to build in-house.
The more realistic middle ground is smoothing, not modeling. When your dataset is thin, under 30 days of logs or fewer than 20 units, a rolling average of 7 or 14 days prevents a single unusual week from distorting your baseline. Cap any growth adjustment at a conservative annual rate unless your own portfolio data clearly supports something higher, since overfitting a tiny sample to an aggressive growth curve is how forecasts end up wrong in both directions.
If you eventually manage enough doors that portfolio-level pattern detection matters, that’s the point to bring in a data analyst or a purpose-built forecasting tool, not before.
What Software Actually Helps With Package Volume Forecasting?
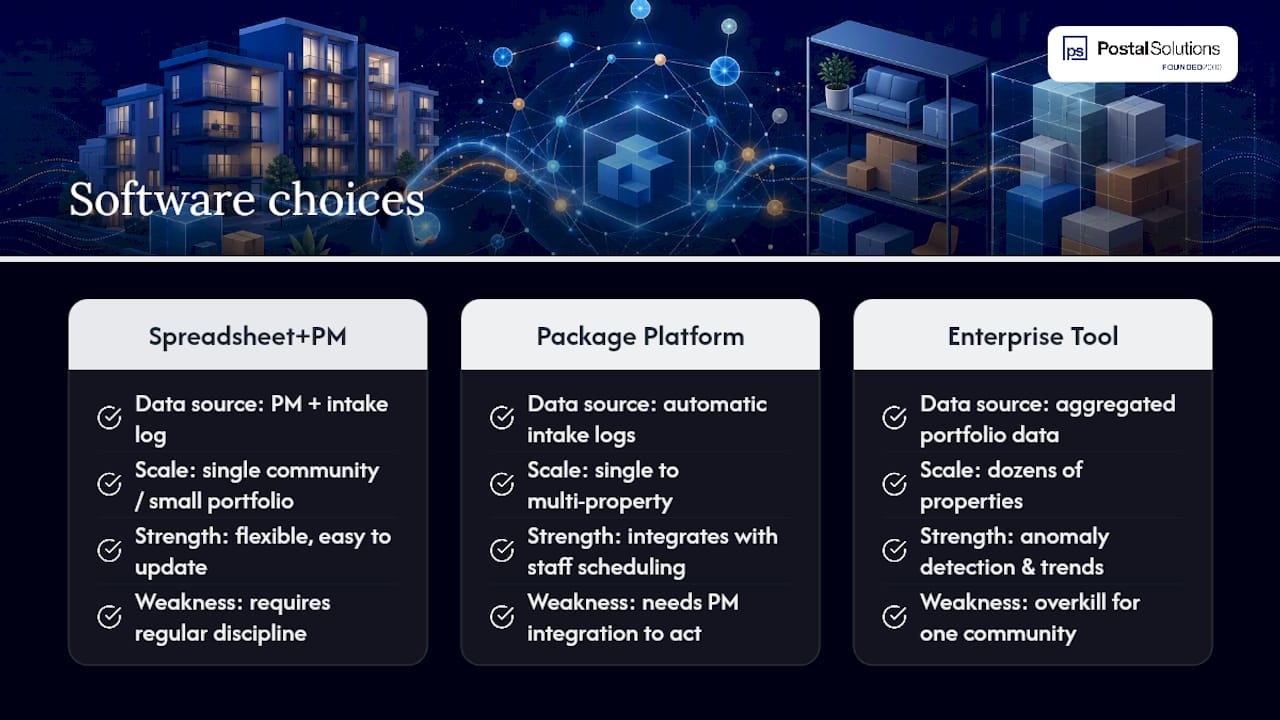
Most of the software layer for package forecasting isn’t a dedicated forecasting tool at all. It’s your intake and notification system generating the data, and a spreadsheet or property management platform turning that data into a usable forecast.
Package management platforms and locker systems typically log every intake event automatically, which solves the data collection problem covered earlier without requiring manual entry. That log is your forecasting input. Where it gets connected to broader operations is through your property management software, since staffing schedules, budget planning, and even resident communication often live in the same system. Comparing platform options like Buildium and AppFolio is worth doing specifically around how well each integrates package data with staff scheduling, since that connection is what turns a forecast into an actual staffing decision rather than a static report nobody checks.
Beyond that, dedicated forecasting software exists mostly at enterprise portfolio scale, built for operators managing dozens of properties who need automated anomaly detection and trend flagging across the whole book. For a single community or a small portfolio, that level of tooling is usually overkill. A well-maintained spreadsheet with the fields and formulas covered in the checklist section, reviewed weekly by one accountable owner, outperforms an expensive platform nobody updates.
The honest gap in most package software isn’t the forecasting math. It’s the operational discipline to log intake consistently and review the numbers on a set cadence, which is a staffing and process question more than a technology one.
Where Does Your Package Volume Data Actually Come From?
Your best forecasting inputs are the ones you already generate every day: carrier intake logs. Whether that’s a locker system’s automatic scan record, a managed package room’s manual log, or a hybrid of both, every recorded delivery is a data point worth capturing, provided you’re capturing the right fields.
Beyond your own intake records, three outside sources fill in gaps a single property’s data can’t cover. Industry benchmark reports, like the NAAHQ package management data cited throughout this guide, give you a comparison point when your own log is too new or too thin to trust. Academic studies of real buildings, like the Metrans residential parcel delivery research, provide the weekday and seasonal multipliers most operators would otherwise have no way to calculate independently. And carrier-side data, when a carrier rep will share route density or delivery frequency for your area, can flag a shift before it shows up in your own numbers.
The collection method matters as much as the source. Same-day logging beats end-of-week batch entry every time, since memory fades and details like the oversize flag get skipped under time pressure. Whether you’re using a locker system with automatic scanning or a manual log sheet, the four core fields, date, carrier, unit, parcel count, plus the oversize/refrigerated flag, need to be captured at the moment of intake, not reconstructed later from memory.
Why Do Carrier Intake and Chain-of-Custody Controls Matter So Much?
A forecast is only as good as the intake process feeding it, and carrier non-compliance is one of the most common ways that process breaks down. Drivers bypassing formal intake, leaving packages in a lobby, propping open a locker room door, skipping the scan step, corrupts your data and creates the missing-package disputes that generate resident complaints.
Formal carrier onboarding fixes most of this before it starts. A pictorial standard operating procedure posted at the intake point, paired with a brief in-person walkthrough for regular drivers, cuts down on improvised workarounds. Every carrier, USPS, UPS, FedEx, and Amazon’s delivery network, should know exactly where packages go and how they’re logged before they ever make a delivery to your property.
Resident notifications close the loop on the other end. Automated text or email alerts the moment a package is logged reduce dwell time, which directly affects your shelving math, since faster pickup means less parcel-day accumulation at any given moment.
Weekly audits tie the whole system together. A physical count against the log catches discrepancies, missing scans, misplaced parcels, oversized items stored outside their designated area, before they become a resident complaint. Chain-of-custody logging, timestamped records of who received, sorted, and released each parcel, is what lets you resolve a dispute in minutes instead of days when a resident says a package never arrived.
The Real Gap in Most Forecasting Advice
Most guidance on package forecasting treats it as a math problem: plug in a baseline, apply a multiplier, done. That’s incomplete. The math is genuinely the easy part, and any property manager comfortable with a spreadsheet can build a workable forecast in an afternoon using the method in this guide.
The harder, more overlooked piece is the operational discipline to keep the underlying data clean. A forecast built on inconsistent logging, carriers bypassing intake, staff skipping the oversize flag, nobody reviewing the weekly totals, drifts from reality within a month regardless of how sound the formula is. We’d argue the weekly audit matters more than the forecasting formula itself, since the audit is what tells you whether your baseline still reflects what’s actually happening in the package room.
The other gap is treating peak season as a scaled-up version of a normal week rather than a fundamentally different operation.
If you take one thing from this guide, prioritize the intake log over the forecasting formula. A clean, consistently captured 30 days of real data will outperform a sophisticated model built on guesswork every time.
— Postal Solutions
Let Postal Solutions Run the Forecast and the Package Room
Building your own forecasting spreadsheet is a fine start, but running it well every week, on top of intake, sorting, resident notifications, and holiday surge staffing, is a second job most leasing teams didn’t sign up for. Postal Solutions is the alternative to building that operation yourself: a dedicated on-site Package Manager works your community up to six days a week, handling the intake logging, weekly audits, carrier onboarding, and surge staffing that keep a forecast accurate instead of theoretical.
That means the baseline math, seasonality multipliers, and surge buffers covered in this guide get applied by someone whose full-time job is your package room, not squeezed between lease renewals and maintenance calls. The service integrates with whatever locker or shelving system you already have, handles oversized and refrigerated deliveries, and can be structured as a resident amenity that offsets its own cost. For a closer look at how on-site management compares to shipping packages offsite, see why on-site wins for residents, then reach out to get your property’s specific volume and staffing numbers assessed.
Sources
FAQ
What Is a Good Baseline for Package Volume Forecasting?
Use 1.5 packages per unit per week, or roughly 0.5 per resident per week, as your starting benchmark when you don’t yet have property-specific intake logs, based on Metrans research on a 300-unit building.
How Much Does Package Volume Increase During the Holidays?
Expect a 2x to 4x increase over baseline, with industry data showing average weekly volume jumping from about 150 to roughly 270 packages during peak holiday weeks.
How Many Staff Hours Does Package Handling Typically Require?
About a third of property teams report spending more than four hours per week on package handling under normal, non-holiday conditions.
Should I Use Lockers or a Managed Package Room?
It depends on your daily volume: lockers work well for standard-size deliveries at lower-volume properties, while open shelving handles oversized and perishable items better and scales more easily during surges, which is why many higher-volume communities use both, often through a managed on-site package room.
How Often Should I Audit My Package Room?
Run a weekly physical audit against your intake log at minimum, since weekly audits and chain-of-custody logging are the fastest way to catch discrepancies before they become resident disputes.
Recommended
Ready when you are
Fix your package room — start with a free proposal
Daily on-site Package Manager, resident text & email pings*, and a tour-ready amenity. Tell us your unit count and we'll send a right-sized proposal — usually within one business day.
- ✓ 16–30 hours back every week
- ✓ Works with any locker system
- ✓ Faster, friction-free resident pickup
- ✓ An easy ancillary income addition